
Accuracy, precision & resolution
Quantities can't be determined with absolute certainty. Measurement tools and systems have always some tolerance and disturbances that will introduce a degree of uncertainty. In addition, also the distinctiveness is a limiting factor.
The following terminology are often used in relation to the measurement uncertainty:
- Accuracy: The error between the real and measured value.
- Precision: The random spread of measured values around the average measured values.
- Resolution: The smallest to be distinguished magnitude from the measured value.
In practice these terms are often confused. This article discusses these concepts.
Measurement uncertainty
Measurement uncertainties can be divided into systematic and random measurement errors. The systematic errors are caused by abnormalities in gain and zero settings of the measuring equipment and tools. The random errors caused by noise and induced voltages and/or currents.
Definition accuracy and precision
Often the concepts accuracy and precision are used interchangeably; they are regarded as synonymous. These two terms, however, have an entirely different meaning. The accuracy indicates how close the measured value is from its actual value, i.e. the deviation between the measured and actual values. Precision refers to the random spread of the measured values.
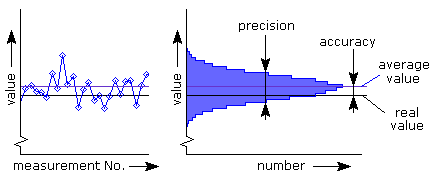
When a number of measurements is done to a stable voltage or other parameter, the measured values will show a certain variation. This is caused by thermal noise in the measuring circuit of the measuring equipment and the measurement set-up. The left graph in Figure 1 shows these variations.
Histogram
The measured values can be plotted in a histogram as shown in Figure 1. The histogram shows how often a measured value occurs. The highest point of the histogram, this is the measured value that has been most frequently measured, indicates the mean value. This is indicated by the blue line in both graphs. The black line represents the real value of the parameter. The difference between the average measured value and real value is the accuracy. The width of the histogram indicates the spread of individual measurements. This distribution of measurements is called precision.
Use the correct definition
Accuracy and precision thus have a different meaning. It is therefore quite possible that a measurement is very precise but not accurate. Or conversely, a very accurate measurement, but not precise. In general, a measurement is considered valid if both the measurement is precise as well accurate.
Accuracy
Accuracy is an indication of the correctness of a measurement. Because at a single measurement the precision affects also the accuracy, an average of a series of measurements will be taken.
The uncertainty of measuring instruments is usually given by two values: uncertainty of reading and uncertainty over the full scale. These two specifications together determine the total measurement uncertainty.
These values for the measurement uncertainty is specified in percent or in ppm (parts per million) relative to the current national standard. 1 % corresponds to 10000 ppm.
The specified uncertainty is quoted for specified temperature ranges and for certain time period after calibration. Please also note that at different ranges other uncertainties may apply.

Uncertainty relative to reading
An indication of a percentage deviation without further specification also refers to the reading. Tolerances of voltage dividers, the exact gain and absolute deviation of the readout and digitization cause this inaccuracy.
A voltmeter which reads 70,00 V and has a "±5 % reading" specification, will have an uncertainty of 3,5 V (5 % of 70 V) above and below. The actual voltage will be between 66,5 en 73,5 volt.

Uncertainty relative to full scale
This type of inaccuracy is caused by offset errors and linearity errors of amplifiers. And with instruments that digitizes signals, by the non-linearity of the conversion and the uncertainty in AD converters. This specification refers to the full-scale range that is used.
A voltmeter may have a specification "3 % full scale". If during a measurement the 100 V range is selected (= full scale), then the uncertainty is 3 % of 100 V = 3 V regardless of the voltage measured.
If the readout in this range 70 V, then the real voltage is between 67 and 73 volts.
Figure 3 makes clear that this type of tolerance is independent of the reading. Would a value of 0 V being read; in this case would the voltage in reality between -3 and +3 volts.
Full scale uncertainty in digits
Often give digital multimeters the full-scale uncertainty in digits instead of a percentage value.
A digital multimeter with a 3½ digit display (range -1999 t / m 1999), the specification can read "+ 2 digits". This means that the uncertainty of the display is 2 units. For example: if a 20 volt range is chosen (± 19.99), than the full scale uncertainty is ±0.02 V. The display shows a value of 10.00 than the actual value shall be between 9.98 and 10.02 volts.

Calculation of measurement uncertainty
The specification of the tolerance of the reading and the full scale together determine the total measurement uncertainty of an instrument. In the following calculation example the same values are used as in the examples above:
Accuracy: ±5 % reading (3 % full scale)
Range: 100 V, Reading: 70 V
The total measurement uncertainty is now calculated as follows:
 [equ. 1]
In this situation, a total uncertainty of 7.5 V up and down. The real value should be between 62.5 and 77.5 volts. Figure 4 shows this graphically.
The percentage uncertainty is the relationship between reading and uncertainty. In the given situation this is:
![]() [equ. 2]
[equ. 2]
Digits
A digital multimeters can hold a specification of "±2.0 % rdg, + 4 digits. This means that 4 digits have to be added to the reading uncertainty of 2 %. As an example again a 3½ digit digital readout. This will read 5.00 V in while the 20 V range is selected. 2 % of the reading would mean an uncertainty of 0.1 V. Add to this the inaccuracy of the digits (= 0.04 V). The total uncertainty is therefore 0.14 V. The real value should be between 4.86 and 5.14 volts.
Cumulative uncertainty
Often only the uncertainty of the measuring instrument is taken into account. But also must be looked after the additional measurement uncertainty of the measurement accessories if these are used. Here are a couple of examples:
Increased uncertainty when using probe 1:10
When a 1:10 is used, not only the measurement uncertainty of the instrument must take into account. Also the input impedance of the used instrument and the resistance of the probe, who make together a voltage divider, shall influence the uncertainty.

Figure 5 shows schematically an oscilloscope with a 1:1 probe. If we consider this probe as ideal (no series resistance), the voltage applied to the probe is offered directly at the input of the oscilloscope. The measurement uncertainty is now only determined by the tolerances in the attenuator, amplifier and further processing, and is specified by the manufacturer.
(The uncertainty is also influenced by the resistance network that forms the internal resistance Ri. This is included in the specified tolerances.)

Figure 6 shows the same scope, but now a 1:10 probe is connected to the input. This probe has an internal series resistance Rp and together with the input resistance of the oscilloscope Ri will this form a voltage divider. The tolerance of the resistors in the voltage divider will cause it's own uncertainty.
The tolerance of the input resistance of the oscilloscope can be found into the specifications. The tolerance of the series resistance Rp of the probe is not always given. However, the system uncertainty stated by the combination of the oscilloscope probe with a specified type oscilloscope will be known. If the probe is used with another type than the prescribed oscilloscope, the measurement uncertainty is undetermined. This must always be avoided.
Suppose that an oscilloscope has a tolerance of 1.5 % and a 1:10 probe is used with a system uncertainty of 2.5 %. These two specifications can be multiplied together to obtain total reading uncertainty:
 [equ. 3]
Measuring with a shunt resistor

To measure currents an external shunt resistor is often used. The shunt has a certain tolerance that affects the measurement.
The specified tolerance of the shunt resistor refers to the reading uncertainty. To find the total uncertainty, the tolerance of the shunt and the reading uncertainty of the measuring instrument are multiplied together:
 [equ. 4]
In this example, the total reading uncertainty is 3.53 %.
The resistance of the shunt is temperature dependent. The resistance value is specified for a given temperature. The temperature dependence is often expressed in ppm/°C.
As an example the calculating of the resistance value at ambient temperature (Tamb) of 30 °C. The shunt has a specification: R=100 Ω @ 22 °C (respectively Rnom & Tnom), and a temperature dependence of 20 ppm/°C.
 [equ. 5]
The current flowing through the shunt causes dissipation of energy in the shunt and this will result in rising of the temperature and therefore a change in resistance value. The change in resistance value due to the current flow is dependent on several factors. For very accurate measurements the shunt must be calibrated at a flow resistance and environmental conditions in which these will be used.
Precision
The term precision is used to express the random measurement error. The random nature of the deviations of the measured value is mostly of thermal origin. Because of the arbitrary nature of this noise it's not possible to give an absolute error. The precision gives only the probability that the measurement value is between given limits.

Gaussian distribution
Thermal noise has a Gaussian or normal distribution. This is described by the following equation:
 [equ. 6]
Here is μ the mean value and σ indicates the degree of dispersion and corresponds to the RMS value of the noise signal. The function provides a probability distribution curve as shown in Figure 8 where the mean value μ 2 is and the effective noise amplitude σ 1.
| Border | Chance |
| 0,5·σ | 38.3 % |
| 0,674·σ | 50.0 % |
| 1·σ | 68.3 % |
| 2·σ | 95.4 % |
| 3·σ | 99.7 % |
Probability table
Table 1 lists some chance values expressed at a certain limit. As seen, the probability that a measured value is within ±3·σ is 99.7 %.
Improving precision
The precision of a measurement can be improved by oversampeling or filtering. The individual measurements are averaged out so that the noise quantity is greatly reduced. The spread of the measured values is hereby also reduced. With oversampling or filtering must be taken into account that this may reduce the bandwidth.
Resolution
The resolution of a measurement system is the smallest yet to distinguish different in values. The specified resolution of an instrument has no relation to the accuracy of measurement.
Digital measuring systems
A digital system converts an analog signal to a digital equivalent with an AD converter. The difference between two values, the resolution, is therefore always equal to one bit. Or in the case of a digital multimeter, this is 1 digit.
It's also possible to express the resolution in other units than bits. As an example a digital oscilloscope which has an 8 bit AD converter. If the vertical sensitivity is set to 100 mV/div and the number of divisions is 8, the total range will be 800 mV. The 8 bits represent 28 = 256 different values. The resolution in volts is then 800 mV / 256 = 3125 mV.
Analog measuring systems
In the case of analog measuring instruments where the measured value is displayed in a mechanical way, such as a moving-coil meter, it's difficult to give an exact number for the resolution. Firstly, the resolution is limited by the mechanical hysteresis caused by friction of the bearings of the needle. On the other hand, resolution is determined by the observer, making this a subjective evaluation.