
Theory & Definitions
Connecting a measurement instrument in the right way only is one thing. But, to determine the correct parameter needs more considerations.
Very important is the question: For what purpose do I do this measurement?
Performing a current measurement to examine the heat development in a wire requires a different parameter than a current measurement to determinate the charge status of a capacitor or battery.
Parameters can be expressed as an average, RMS, instantaneous or peak value. Not only the type of load is important, but also whether this is an AC or DC source, and what the voltage and current shape looks like.
The closely related interaction between voltage and current, and power and energy on the other hand will be discussed on this page.
Instantaneous values
The instantaneous voltage v, current i and power p has a value that corresponds to a specific time t. Every waveform has an infinity number of instantaneous values. Such a waveform is described as the parameter as a function of time. In the case of a voltage it will be written as v(t).
In the example below, the situation of a series circuit of a resistor and a coil connected to a sinusoidal voltage with a peak voltage of 3 V and a frequency f of 50 Hz.

The sinusoidal voltage as a function of the time is written as:
![]() [equ. 1]
[equ. 1]
The current has a top value of 2 A and is shifted 60° in relation to the voltage.
![]() [equ. 2]
[equ. 2]
The power as a function of time is the product of the corresponding instantaneous values of voltage and current:
![]() [equ. 3]
[equ. 3]
Figure 1 shows the graphical representation of the voltage, current and power. As an example; the instantaneous values are shown for the time t = 4,2 ms marked with the gray line:
v(4,2 ms) = 2,906 V
i(4,2 ms) = 0,538 A
p(4,2 ms) = 1,563 W
At a certain time, the instantaneous voltage and current can always be multiplied to calculate the instantaneous power.
Average values
The average value, also called the mean value, is the most commonly used parameter. If a multimeter is set for measuring DC-values, the average voltage or current is measured. Also the average value of an AC voltage or current is measured when the meter is set to DC. In case of a symmetrical AC voltage the multimeter will indicate 0 V, which is the correct value.
Voltage and current
The average value is the sum of all products of the instantaneous values x multiplied by the infinitely small time dt divided by the period T wherein is measured. This summation with infinitely small time steps is called integrate. In general written as:
![]() [equ. 4]
[equ. 4]
X for example can represent the voltage or current. Filled in for the voltage:
![]() [equ. 5]
[equ. 5]
Multimeter

As mentioned before, a multimeter selected into a DC-range measures the average value of the voltage or current. In digital meters, this average established by means of a RC-filter. This is the input signal continuously averaged over the RC-time. In formula form:
 [equ. 6]
Energy and power
Equation 3 shows that the product of the instantaneous voltage and current results in the instantaneous power p(t). If these instantaneous powers multiplied by the infinitely small time dt are continuously summed, it will return the energy in the system since t = 0 s:
![]() [equ. 7]
[equ. 7]
Indeed, energy is the power multiplied by time: E = P·t, and energy packets may always added together to calculate the total energy.
Below are the signals showed again from the example coil-resistant series circuit as discussed in "Instantaneous values". In this figure represents the black line the energy development in time as calculated with equation 7.

The value of the black energy line at any given time is equal to the previous area under the power curve. It is clear to see that the energy line periodically rises more than it falls as a result of the amplitude asymmetry of the power curve around the x-axis.
In figure 3 the time period T is indicated. The energy inside this time (0...T s) that is put into the system is indicated by Eper and will be calculated as follows:
![]() [equ. 8]
[equ. 8]
The average power over a certain time period is equal to the total amount of energy within that time divided by time in wherein is measured:
![]() [equ. 9]
[equ. 9]
If this division by the time is inserted in equ. 8, the average power can be calculated for any waveform:
![]() [equ. 10]
[equ. 10]
This equation is consistent with the general equation for calculating an average value (equ. 4). The active power is always the average power.
This equation to calculate the average dissipated power is always valid because the calculation is based on instantaneous values. It does not matter whether this is the direct or alternating current, what the voltage and current shape looks like, or whether there is a phase shift between voltage and current exists.
The equation above to calculate the average power is the method by which the operation of a power meter is based on. An energy meter like a kilowatt-hour meter at houses and industries operates according to comparison 8. Or otherwise written as:
![]() [equ. 11]
[equ. 11]
The upper limit T of the integral is the point of time where the energy meter is readout.
RMS values
The RMS or effective value is a value for a voltage or current that an equally great power in a resistance dissipates as a DC voltage or current with the same value.
An alternating voltage with an effective value of 230 V will develop a same amount of heat in a resistor as a pure DC voltage of 230 V. The RMS value concerns only to the heat development in a resistive load. As an example: The RMS current is useful to monitor the load stress of a cable (= resistive), but not to measure the charging current from a battery or capacitor (= electron flow).
Root Mean Square
RMS is an abbreviation for Root Mean Square. The voltage or current as a function of time will undergo successively three mathematical operations: quadrate, averaging and square root, to calculate the RMS value. Why these operations take place is explained below:
The power dissipated in a resistor that is connected to a voltage is calculated with:
![]() [equ. 12]
[equ. 12]
For the instantaneous power and voltage this will be:
![]() [equ. 13]
[equ. 13]
How to calculate the average power as function of time was shown in equation 10. p(t) can be filled in equation 13 above:
 [equ. 14]
Because the resistance R is a constant, it can be brought forward:
![]() [equ. 15]
[equ. 15]
When moving the voltage from equation 12 to the left side of the equal sign, the voltage can be calculated from the average power and resistance:
![]() [equ. 16]
[equ. 16]
When the average power calculation from equ. 15 is filled in the equation 16 above:
 [equ. 17]
Both resistor values R in the dividend and divisor eliminate each other and can be left out. This results in the equation that calculates the RMS value for any random voltage waveform:
 [equ. 18]
It is clear to see that the equation consists of three parts: quadrate v(t)2, average, and square root.
The above described analysis is calculated with a voltage over a resistor. For currents trough a resistor a comparing evaluation can be made. The result for RMS currents will than be:
 [equ. 19]

The circuit in figure 4 shows how a RMS-meter the measured voltage computes. A RMS meter in practice will use a slightly different method of operation whereby just one multiplier is needed. Analog multipliers must have a very low temperature and offset drift, which makes these instruments expensive.
It is also possible to do the RMS calculation by software with the continues digitalize values of the measured voltages. This approach is commonly used with multimeters and digital oscilloscopes.
Pseudo RMS
Most multimeters will not measure the RMS-value when the range selector is set to AC mode. Yet, they seem to give the effective value when measuring AC-voltages and currents. But the displayed values are only valid when a sinusoidal waveform is measured.
A simple AVO-meter rectifies the measured signal first. Then a following RC low-pass filter distilled the average value. This resulting mean value is than scaled so that the instrument will show the effective value. Written as an equation:
![]() [equ. 20]
[equ. 20]
The consequence of this approach is that it's only usable for sinusoidal waveforms. Every other shaped waveform will give an erroneous effective value.
RMS power?
Especially in audio communities there is a lavish use of the term "RMS power" or PRMS. This is by definition an erroneous term.
As in the chapter "Mean values" under the heading "Energy and power" is shown that the working power is calculated from the total amount of energy divided by the time wherein this energy is measured (equ. 9). The total energy is defined by summation of all instantaneous energy packets v(t)·i(t)·dt (equ. 11). This is the only correct way to calculate the active power.
As previously explained the RMS value is equivalent to a DC voltage or current which developed a same power in the same resistance. This is calculated by the square root from the average of the instantaneous voltage (or current) in quadrate. There is no reason to think why these three mathematical operations should be applied on the instantaneous power. This would be a nonsensical value.
 [equ. 21]
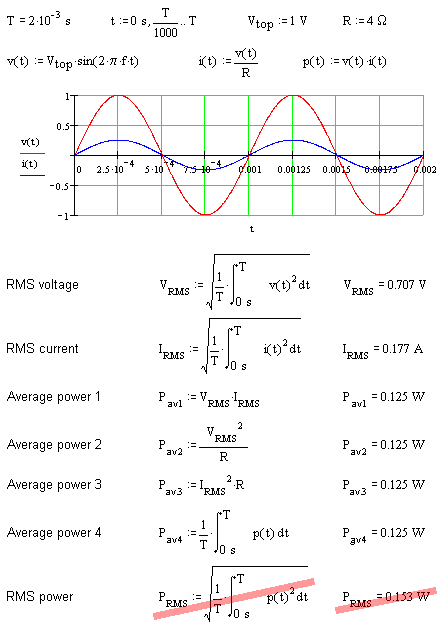
Above the graph are the definitions: The load resistor R is 4 Ω. As a function of time are calculated: the sinusoidal voltage v(t), the current i(t) and the power p(t).
In the graph the voltage and current are displayed.
First the RMS voltage is calculated of the voltage as a function of time v(t). The result is equal to the well-known equation:
![]()
The second equation calculates the RMS current with the current as a function of time i(t). This is equal to:
![]()
Then, with three different methods the Active Power is calculated using the RMS voltage and current values: VRMS·IRMS, VRMS2/IRMS2·R. To check this, with a fourth calculation the average power is determined with the power as a function of time p(t). All these calculations result in the same value for the active or average power.
At last, at the bottom the calculation for the RMS power is done. The outcome of this (0,153 W) differs significantly from the four earlier calculations (0,125 W).
The above example is carried out using a sinusoidal voltage and current. But the shape of the voltage and current as well as the kind of load and possible phase shift are of subordinately importance.
The active power is always the average power. RMS Power is a nonsensical number.